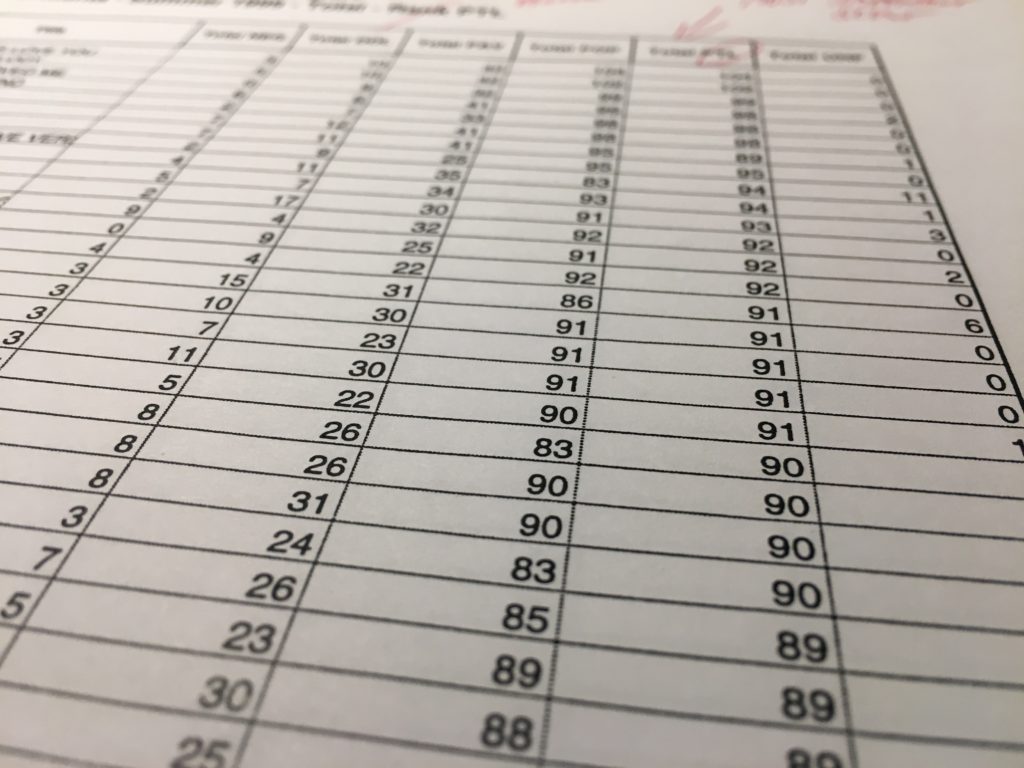
While going full-on Marie Kondo on my radio career box, I unearthed the very first music test I ever implemented back in 1999. It was a hand-me-down AMT from a large-market Soft AC. The format captain of our new owners had graciously shared it with me—and with it started my journey with music research.
What struck me as I looked at that 20-year-old library test wasn’t all the Phil Collins: It was the simple, hand-written instructions on how to implement the test—play songs with Potential over 70, unless the Developed Dislike was above 20 or if Unfamiliar was too high.
I didn’t know how the research company crunched these numbers or where these benchmarks originated. I only knew the station sounded better after the research hit the air.
Now, after 20 years of implementing music research and then helping clients use music research, finding those notes was a slap in the face: I suddenly remembered just how unintuitive and intimidating all those numbers can be—and how those of us in music research should be making it easier to understand the tools we provide.
After all, research should make you feel more confident in your decisions, not more confused.
That’s why we’re bringing you Callout Summer School. Whether you just got access to music research, or you’ve used it for years and simply want to have a deeper grasp on your results, we’re going to walk you through:
- What your song scores mean
- How they relate to your listeners’ reactions to your music
- How you should—and should not—interpret the various scores
In this lesson, we’ll tackle the most fundamental question a music test should answer: Which songs do listeners like most?
Explaining the Five Most Popular Song Scores
All callout begins with playing the most recognizable snippet of a song (the “hook”). If the listener has never heard the song, she’ll mark it “unfamiliar” and not rate it.
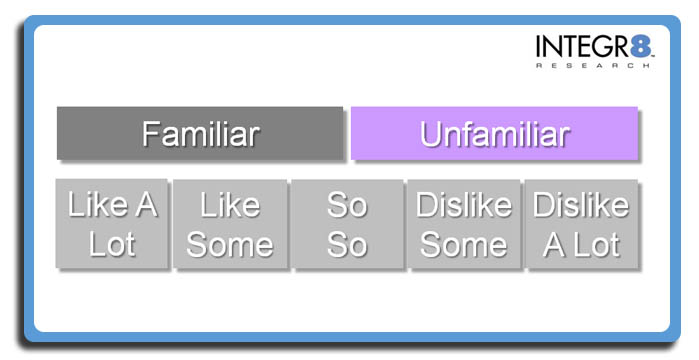
If she does know it, she’ll then say how much she likes or dislikes that song. For example, our Integr8 New Music Research asks listeners to evaluate songs on a scale with five (5) answers.
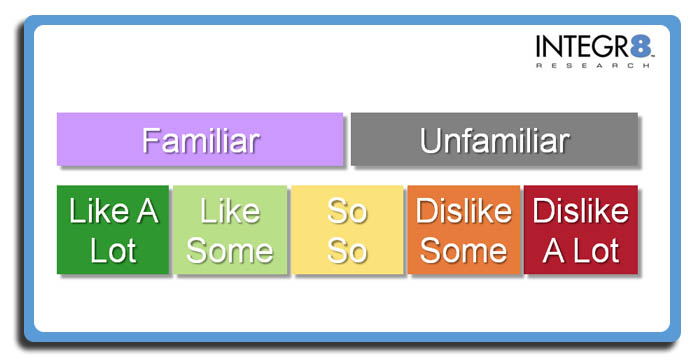
Different companies use different language and even different numbers of possible answers for their song ratings, but the goal is the same: gauge both listeners’ positive and negative reactions to each song.
Here’s how the percentage of listeners who like and dislike each song translates into the five most popular song scores you’ll see in callout reports:
1) Average Score: The score that shows you the good, the bad and the ugly in one number.
Sometimes called “Acceptance”, an Average score is simply how an average listener rates a song. If your music research uses a typical scale with 5 answers, your Average scores would range from 1.00 (if everyone hates a song) to 5.00 (if everyone loves a song). Typically, a strong average score will be above 3.80.
Advantage of Average scores: they give you the overall reaction to a song: for example, a song with a 4.17 means it’s more popular than a song with a 3.29.
Disadvantage of Average scores: They don’t distinguish between songs that listeners generally feel the same about and songs that are polarizing. If most listeners “like” a song, it might have a 4.00 average score. However, a song lots of listeners “like a lot” but some really “dislike a lot” could also have a 4.00 average score.
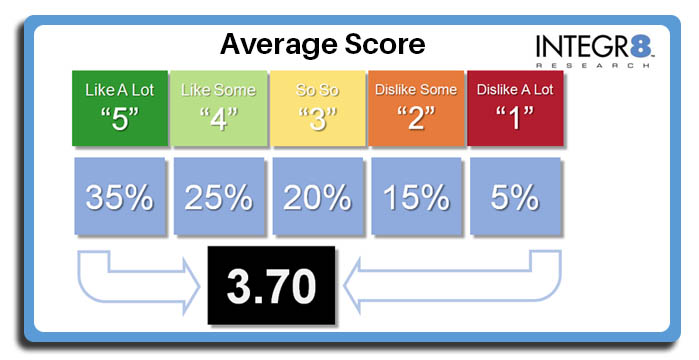
The “Average” score tells you how the typical listener rates a song on a scale of 1 to 5. The more listeners “like” a song, the higher the Average score will be. The more listeners “dislike” a song, the lower the score will be
2) Passion Score: The score that only counts the “crank it up!” reactions
Sometimes called “5 scores”, “Favorite” or “FAV” scores, Passion simply tells you the percentage of listeners who rated the song with the absolute highest score on your scale. Technically, Passion scores could range from 0% to 100%, but high passion scores typically will be in the 40s and 50s.
Advantage of Passion scores: They give you a sense of which songs listeners most passionately love, not simply which songs listeners enjoy.
Disadvantage of Passion scores: For most songs, they ignore how most of your audience feels about the song, since it ignores anyone who dislikes or even merely likes a song.
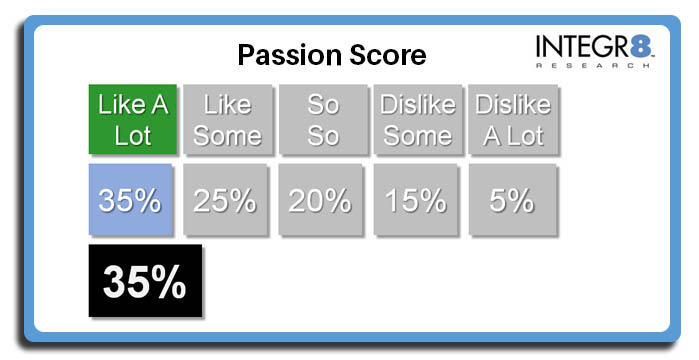
The “Passion” score simply tells you the percentage of your audience that like a song “a lot”
3) Positive Score: The songs they love… and merely like
Sometimes called “Total Positive” or “4+5 scores”, Positive scores show how many listeners rate a song positively, whether they love it or merely like it. Positive scores could range from 0% to 100%, but high positive scores typically will be in the 70s.
Advantage of Positive scores: They’re more comprehensive than Passion scores
Disadvantage of Positive scores: They still ignore listeners who don’t like a song, while also blurring the difference between songs listeners love and songs they merely like.
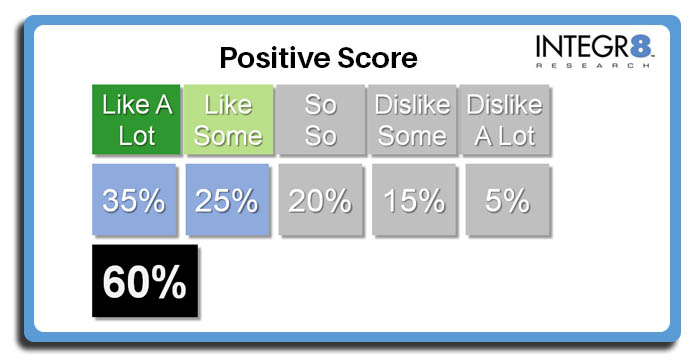
The “Positive” score tells you how many listeners rate a song positively. If 35% of listeners like a song “a lot” and 25% like it “some”, the positive score is 60%
4) Popularity Score: The songs listeners love and know
Also called “Weighted Positive Total Base”, “POP” or a “Zap” score, Popularity scores tell you the songs listeners like most, with an emphasis on the songs listeners really like a lot. Popularity scores can be higher than 100. Typically, 70 or higher is a strong Popularity score.
Advantage of Popularity scores: They offer the advantages of a Passion and a Positive score by “weighting” songs that more listeners “like a lot”, while still counting songs listeners merely “like some”. Plus, they give you this reading among your whole audience—including listeners who don’t know a song and won’t yet have a reaction to it.
Disadvantage of Popularity scores: They punish songs for being unfamiliar—which means that new songs will almost always sink to the bottom. If you simply played songs with the biggest Popularity scores most often, you’d be a recurrent-based radio station. Furthermore, Popularity scores completely ignore negative reactions to a song.
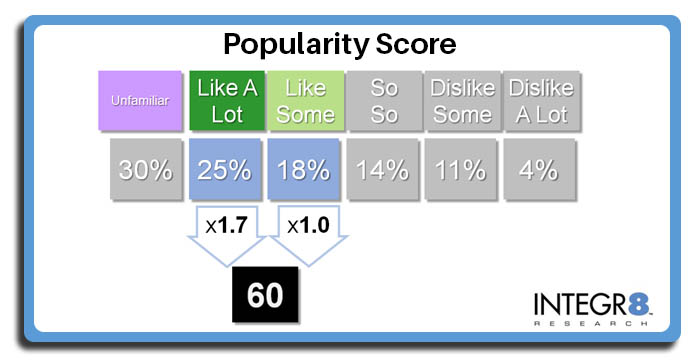
The “Popularity” score tells you which songs listeners know and love most by “weighting” the 25% of listeners who rate the song “like a lot” by 1.7, then adds in the 18% of listeners who rate a song “Like Some”, for a Popularity score of 60. “Popularity” scores punish songs for being highly unfamiliar.
5) Potential Score: The songs listeners would love if they only knew them
Also called “Weighted Positive Familiar Base” or “PTL”, Potential scores use the same calculation as Popularity scores to emphasize songs listeners really “like a lot”, except they only examine those listeners who are actually familiar with each song. Potential scores tend to be a bit higher than Popularity scores, with 85 or higher typically being a strong score.
Advantage of Potential scores: They overcome the inherent bias against new and unfamiliar songs of Popularity scores, giving a more accurate overall reaction to how popular new songs could be once more listeners get to know the song.
Disadvantage of Potential scores: Just like Popularity scores, they totally ignore how many listeners dislike a song.
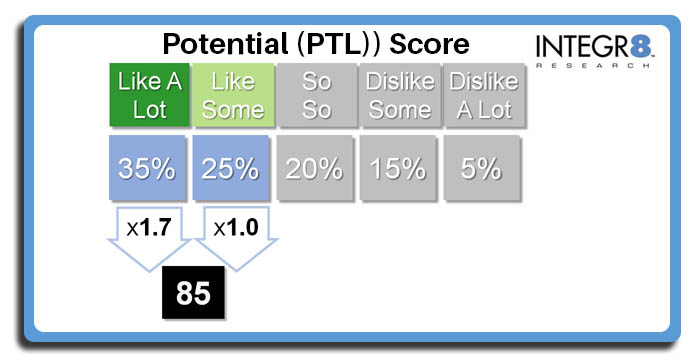
The “Potential” score tells you how popular a song could be by “weighting” the 35% of listeners who know the song and rate it “like a lot” by 1.7, then adds in the 25% of listeners who know the song and rate a song “Like Some”, for a Potential score of 85. Potential scores do not punish songs for being highly unfamiliar
So which of these five scores should I use?
You might as well ask a Southern politician about barbecue.
Different programmers have different preferences, and each of these five metrics (and many other custom scores we’ve implemented for our Integr8 New Music Research clients) can help you find the best songs for each category.
The key is to fully understand both the positive and the negative impact of each and every song you play. The ideal song is one that listeners don’t merely like, but one that makes them shout, “OMG I love this song—turn it up!”
However, some songs that generate that level of passion also generate hate—and in radio, people who passionately dislike a song change the station. For those songs, you’ll have to strategically decide if not playing them is worse than playing them.
Regardless of which song score you use as your go-to metric, you should also examine the full range of listeners’ reactions from love and like to dislike and hate. Most callout reports will provide you this information.
In our next Callout Summer School class, we’ll explain Burn scores—and how not to be burned by them.